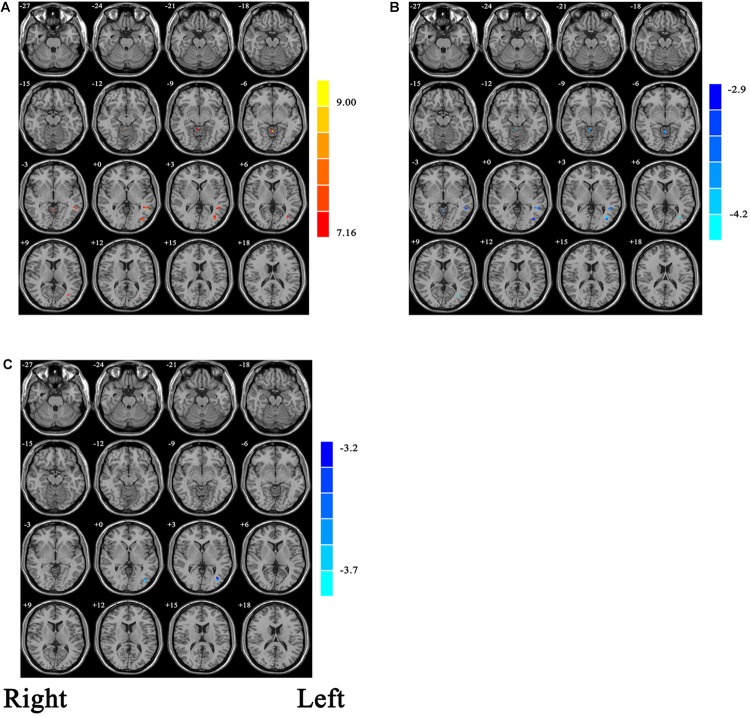
FIGURE 1.
(A) Statistic maps showing ANOVA results of ALFF differences among current major depression disorder (cMDD), remitted major depression disorder (rMDD), and healthy control (HC) groups (p < 0.001, uncorrected). (B) Brain regions showing ALFF differences between cMDD and rMDD [p < 0.008, false discovery rate (FDR) corrected]. (C) Brain regions showing ALFF differences between cMDD and HC (p < 0.008, FDR corrected). ANOVA and post hoc t-tests were conducted using years of education as covariates of no interest. Two-sample t-test results are expressed within a mask showing significant group differences from the ANOVA. Red and blue denote ALFF increases and decreases, respectively; color bars indicate t-values.

