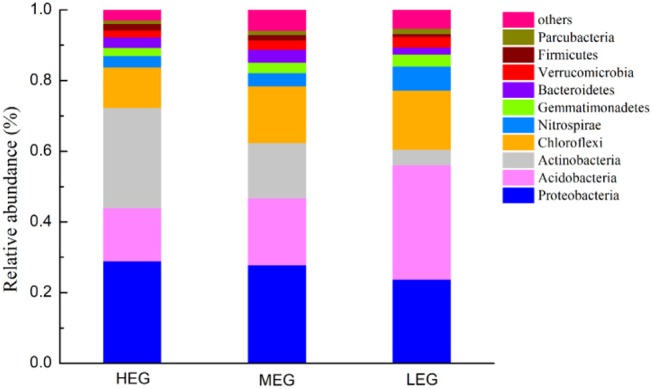
Figure 2.

Relative abundance of the dominant bacterial phyla (with average relative abundance > 1%) among three elevational gradients. HEG high elevational gradient, MEG medium elevational gradient, LEG low elevational gradients.

Relative abundance of the dominant bacterial phyla (with average relative abundance > 1%) among three elevational gradients. HEG high elevational gradient, MEG medium elevational gradient, LEG low elevational gradients.