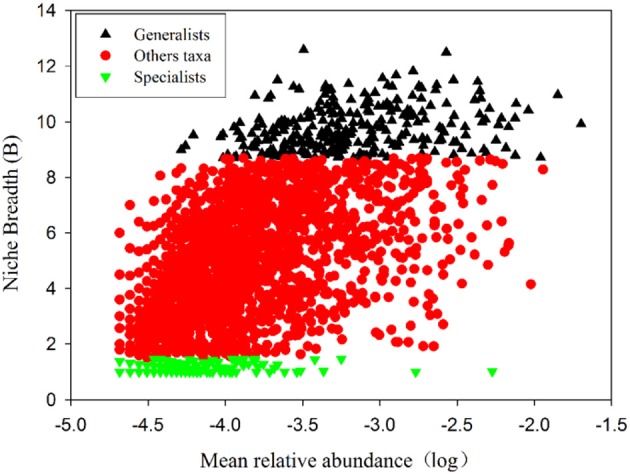
Figure 3.

Habitat specialists and generalists on the northern slope of Mount Wutai. Each dot represents an OTU. The x axis indicates mean relative abundances and the y axis indicates Niche Breadth (B). Generalists (black; B> 8.7), Specialists (green; B < 1.5) and Other taxa (red;1.5 ≤ B ≤8.7) OTUs are indicated.
