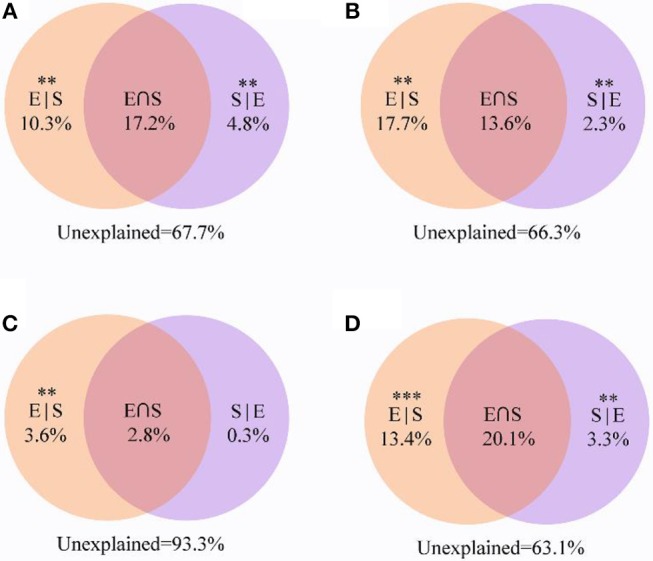
Figure 7.

Variation partitioning analysis showing the percentages of variance in soil bacterial communities explained by environmental factors and spatial distance. (A) All; (B) Generalists; (C) Specialists; (D) Other taxa. The variation explained by pure spatial and environmental factors corresponds to the bacterial community without the effect of the other by ANOVA permutation tests. **P < 0.01 and ***P < 0.001. S|E pure spatial variation, E|S pure environmental variation, S⋂E share explained variation, 1-S|E- E|S-S⋂E unexplained variation.
