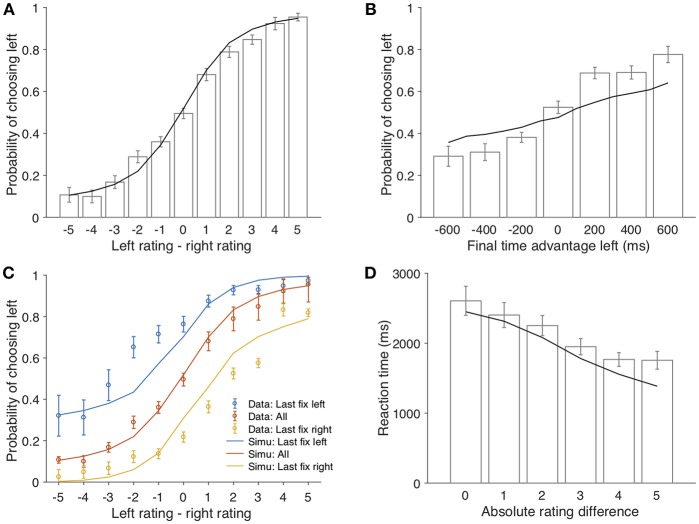
Figure 2.
The model predictions of the behavioral patterns. (A) the probability of choosing the left item as a function of the rating difference between the two items (left-right). Bars represent the experimental data (error bars represent 1 s.e.m across all participants); the black line represents the model simulation results; same for (B,D). (B) probability that the left item is chosen as a function of its total fixation duration advantage over the right item. (C) probability that the left item is chosen as a function of its rating advantage over the right item, conditioned on the last fixation. Yellow circles and the yellow line correspond to trials that participants looked at the left item in the last fixation; blue circles and the blue line correspond to trials that participants looked at the right item in the last fixation; red circles and the red line indicate the average of both. (D) reaction time as a function of absolute rating difference.

