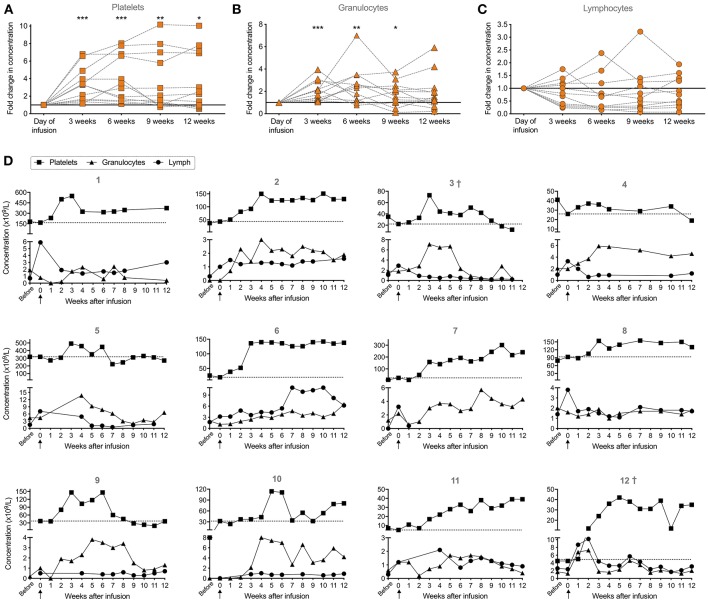
Figure 3.
Clinical parameters (platelet, granulocyte and lymphocyte concentrations in peripheral blood) of patients (n = 12) before, at day of infusion and 12 weeks post-infusion of αβ T-cell depleted stem cell booster. (A) Relative fold change in concentration of platelets, (B) granulocytes, and (C) lymphocytes at 3, 6, 9, and 12 weeks post-infusion. For patients who did not have a reported count for these specific time points, counts from ±1 week were used. Concentration at the day of infusion was set to 1 (indicated by the line) to follow the relative development. Wilcoxon signed-rank test was used to determine paired statistical differences between each time point and the day of infusion. Significance levels were set to p < 0.05 (*), p < 0.01 (**), and p < 0.001 (***). (D) Individual development of the three cellular compartments in each patient (n = 12) where week 0 indicates time point of infusion are presented. Dashed line represents platelet concentration at time point of infusion. †indicates deceased patients at 12 months post-infusion (n = 2, patient 3 died at 4 months and patient 12 died at 8.5 months post-infusion).

