Figure 3.

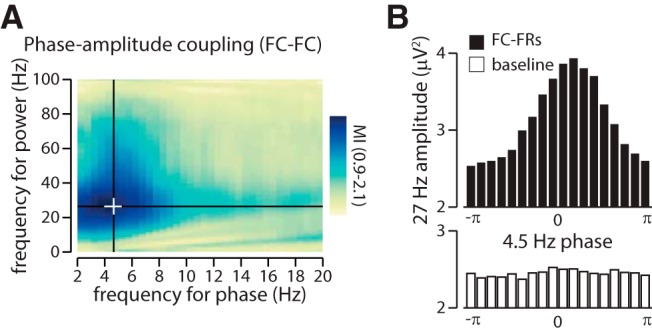
Phase–amplitude coupling ties IED amplitude to the slow-wave oscillation in the frontal cortex. A, Phase–amplitude coupling (PAC) of the power of the IED (peak, 27 Hz) over the phase of the slow oscillation (peak, 4.5 Hz). The plot shows the ratio of the MI (period of interest divided by baseline). The MI is significantly higher during the period of interest than during the baseline (Mann–Whitney U test of the MI around frontal cortex FRs against MI during baseline, p < 0.0001), indicating that a slow wave constrains the expression of IED. The white cross indicates the peak in PAC. B, Distribution of the 27 Hz power along the 4.5 Hz cycle (black, around frontal cortex FRs; white, baseline; i.e., at the peak of PAC; as identified by the white cross in A).
