Figure 5.
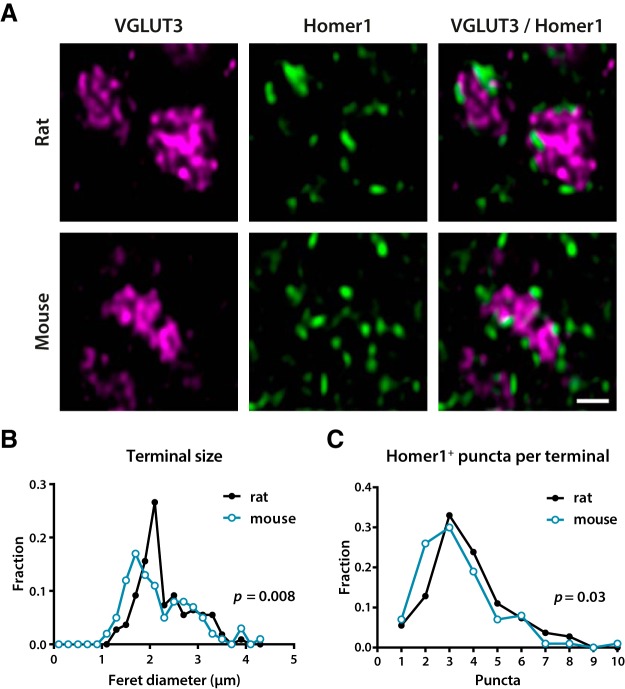
Size and synapse number of VGLUT3+ C-LTMRs. A, Examples of VGLUT3+ presumed C-LTMRs in lamina IIi in spinal cord sections co-immunolabeled for the excitatory synaptic marker Homer1. Each terminal is apposed to several Homer1+ puncta. Note the incomplete filling of the terminals with VGLUT3 immunofluorescence, partly attributed to a high prevalence of axoplasmic mitochondria. The micrographs are single deconvolved optical sections acquired with a 63×/1.4 objective. Scale bar, 1 µm, valid for all panels. B, Frequency distribution of the maximum Feret diameter of VGLUT3+ terminals in lamina IIi. Mouse and rat distributions were compared using the Kolmogorov–Smirnov test. C, Histogram of the number of associated Homer1+ puncta per VGLUT3+ terminal, as assessed from all optical sections occupied by a terminal. Statistical significance of the difference between mouse and rat distributions was tested using Mann–Whitney U test.

