Figure 4.
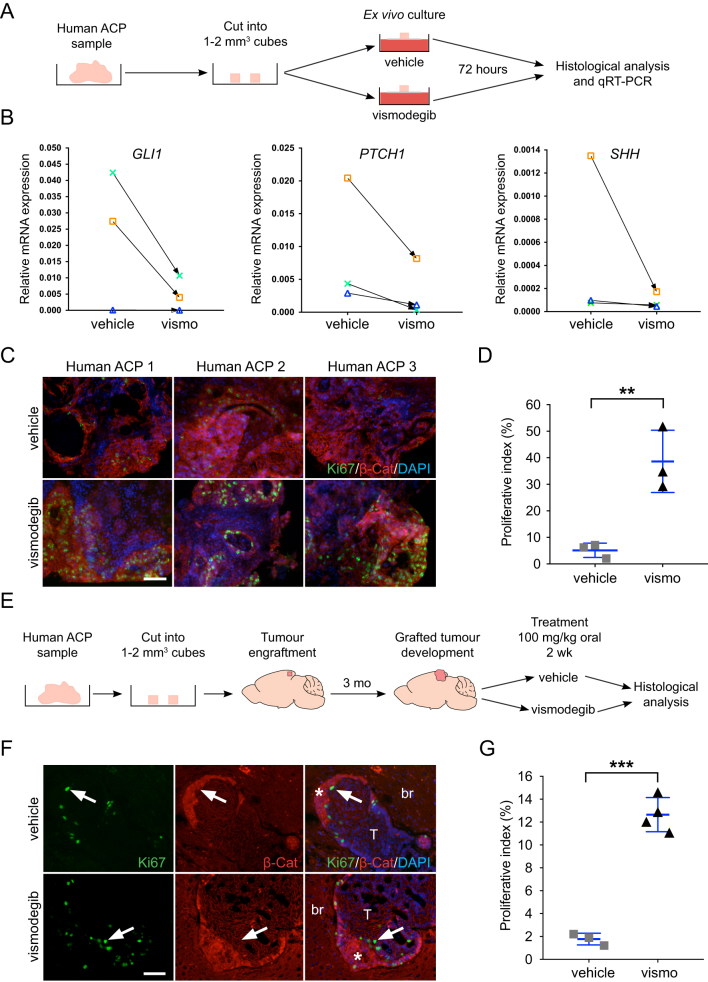
Inhibition of the SHH pathway leads to increased tumour cell proliferation in both explant cultures and xenograft models of human ACP. (A) Schematic diagram of the explant culture experiments. Three ACP tumour samples were cut into 1–2 mm3 cubes and cultured in the presence of vismodegib (100 μM) or vehicle (DMSO). Four biological replicates were performed for each analysis (i.e. four pieces of tumours per treatment). (B) qRT-PCR analysis showing the overall inhibition of the SHH pathway as assessed by a variable reduction in GLI1, PTCH1 and SHH expression upon vismodegib treatment in three human ACP tumours. One sample did not show reduction of GLI1, but both PTCH1 and SHH expression were reduced. (C) Double immunofluorescence on FFPE histological sections showing increased expression of Ki67+ve in the human ACP explants cultured in the presence of vismodegib relative to the DMSO-treated controls. Scale bar: 25 μm. (D) Quantitative analysis revealing a higher Ki67+ve proliferative index in vismodegib compared with vehicle-treated explants (vehicle: 5.1 ± 3%; vismodegib: 38.7 ± 12%; n = 3 tumours per group; P = 0.0085, Student’s t-test, 10,037 DAPI +ve nuclei counted). (E) Schematic diagram of the human ACP xenograft experiments. Two human ACP tumours were cut into 1–2 mm3 and implanted into the cortex of 20 immunosuppressed mice (11 animals with tumour 1 and 9 with tumour 2). Three months later, mice were randomised into two groups of 10 mice each and dosed twice daily with 100 mg/kg vismodegib or vehicle for 21 days, after which brains were dissected and analysed histologically. (F) Double immunofluorescent staining revealing the presence of Ki67+ve cells (arrows) in the proximity of β-catenin-accumulating cell clusters (asterisks) in both vismodegib and vehicle-treated xenografted human ACP tumours. Scale bar: 25 μm. (G) Quantitative analysis showing an elevation of the Ki67 proliferative index in the xenografted tumours upon treatment with vismodegib (vehicle: 1.8 ± 0.5%, n = 3 tumour-bearing mice; vismodegib: 12.7 ± 2%, n = 4 tumour-bearing mice; P < 0.0001, Student’s t-test, 2332 DAPI +ve nuclei counted). All graph bars represent mean ± s.d.

 This work is licensed under a