
Figure 1.
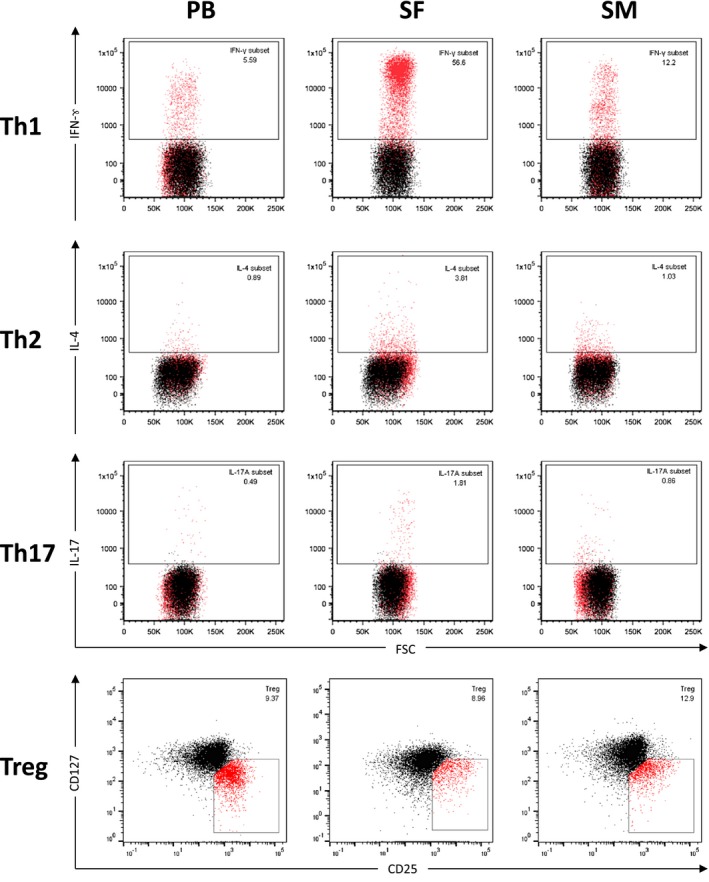
Flow cytometry analysis of CD4+ T cell subsets from samples of peripheral blood, synovial fluid and synovial membrane. Flow cytometry analysis of mononuclear cells derived from synovial membrane (SM), synovial fluid (SF) and peripheral blood (PB) of representative end‐stage OA patients are shown. After isolation and stimulation, T cells were stained with phycoerythrin‐cyanin 7 (PE‐Cy7)‐conjugated monoclonal antibodies (mAb) against CD3 (clone SK7) and VioBlue‐labelled mAb against CD8 (clone BW135/80). Allophycocyanin (APC)‐Cy7‐conjugated mAb against CD4 (clone RPA‐T4) was used to confirm CD4 expression. After permeabilization, cells were stained with APC‐labelled anti‐interferon (IFN)‐γ (clone B27), fluorescein isothiocyanin (FITC)‐labelled anti‐interleukin (IL‐4) (clone MP4‐2502) and PE‐labelled anti‐IL‐17A (clone N49‐653). Mononuclear cells were gated based on their forward‐/side‐scatter (FSC/SSC) profile [numbers in the boxes represent percentage rates (%)] and further defined by cell surface markers as CD3+CD4+CD8– T cells. Th cells were defined by production of their specific cytokines [T helper type 1 (Th1): IFN‐γ, Th2: IL‐4, Th17: IL‐17A) by flow cytometry. Cut‐off was defined by isotype controls (shown as black overlay population). Regulatory T cells (Treg) were identified as CD4+CD25+/highCD127low/– T cells by flow cytometry after staining with FITC‐labelled mAb against CD4 (clone RPA‐T4), PE‐labelled mAb against CD25 (clone MA251) and peridinin chlorophyll (PerCP)‐Cy5.5‐labelled mAb against CD127 (clone RDR5). Cell debris and dead cells were previously excluded [7‐aminoactinomycin D (7‐AAD) staining and FSC profile]. Cut‐off was defined by fluorescence minus one (FMO)/isotype controls, as previously described 19. Representative dot‐plots are shown.