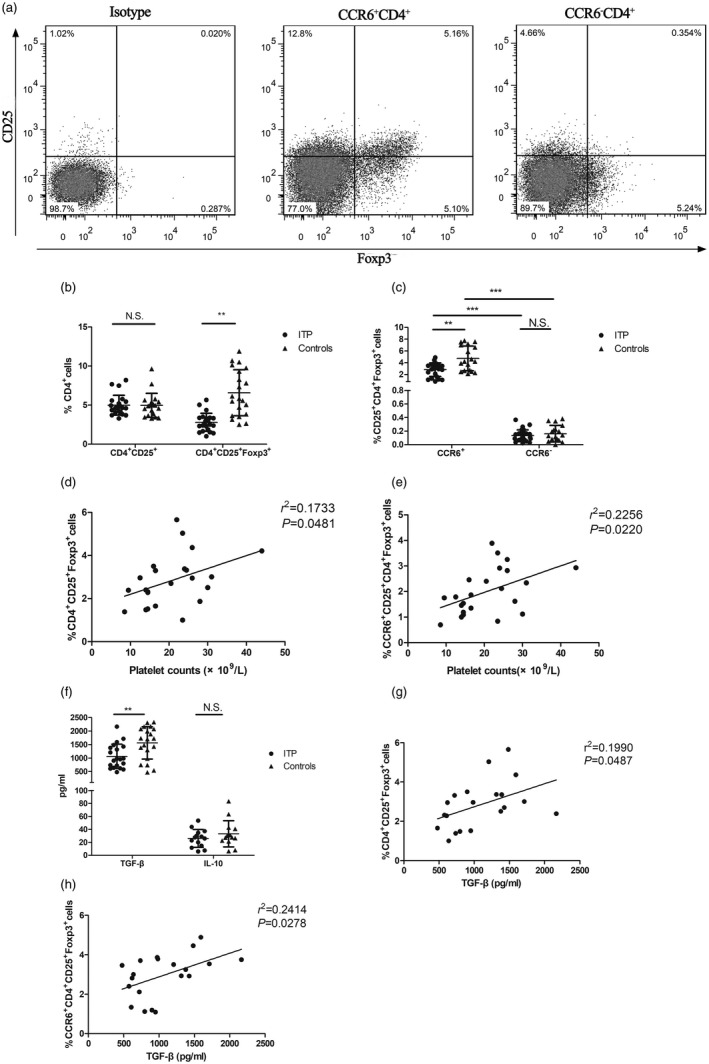
Figure 4.

C‐C chemokine receptor (CCR)6+ regulatory T cells (Treg) cells in immune thrombocytopenia (ITP) patients. (a) Representative example of a flow cytometry density plot of CD25 and forkhead box protein 3 (FoxP3) expression in the population of CCR6+CD4+T cells and CCR6–CD4+ T cells from a healthy control. (b) Summary of frequencies of CD4+CD25+ cells and CD4+CD25+FoxP3+ cells in ITP patients (n = 23) and healthy controls (n = 21). (c) Frequencies of CD4+CD25+FoxP3+ cells in the CCR6+ versus CCR6– subset were analyzed in ITP patients (n = 23) and healthy controls (n = 20). Correlation between the frequency of (d) CD4+CD25+FoxP3+ cells or (e) CCR6+CD4+CD25+FoxP3+ cells and platelet counts in ITP patients (n = 23). (f) Transforming growth factor (TGF)‐β and interleukin (IL)‐10 in plasma were measured in ITP patients (n = 20 and n = 16, respectively) and healthy controls (n = 20 and n = 16, respectively). Correlation between the frequency of (g) CD4+CD25+FoxP3+ cells or (H)CCR6+CD4+CD25+FoxP3+ cells and TGF‐β levels in ITP patients (n = 20). Each symbol represents one individual; horizontal bars indicate means ± standard deviation (s.d.). **P < 0·01, ***P < 0·001; n.s. = not significant.
