
Figure 3.
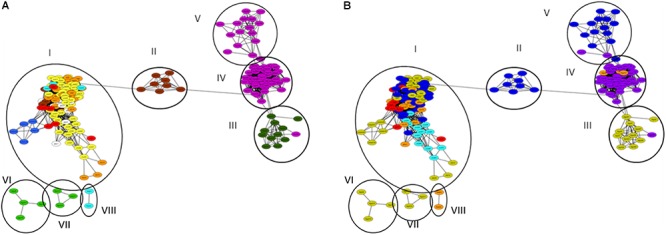
β-lactamase homologs gene network of analyzed metagenomes. Circles and Roman numerals represent clusters defined using network analyzer in Cytoscape. (A) Network color-code based on environment: bovine rumen (light green); bovine feces (dark green); human feces (purple); aerobic (activated sludge) municipal wastewater treatment (red), anaerobic municipal waste and food digestion reactors (brown); non-agricultural soil (yellow); agricultural soil (orange); glaciers (white); fresh water (light blue); marine (dark blue). Anaerobic municipal waste samples were primarily associated with Cluster I, whereas anaerobic food digesters all grouped in Cluster II. (B) Network color-coded based on geographical origin: United States (blue); Israel (light blue); Northern Europe (purple), Central Europe (orange); China (red); Australia (yellow).