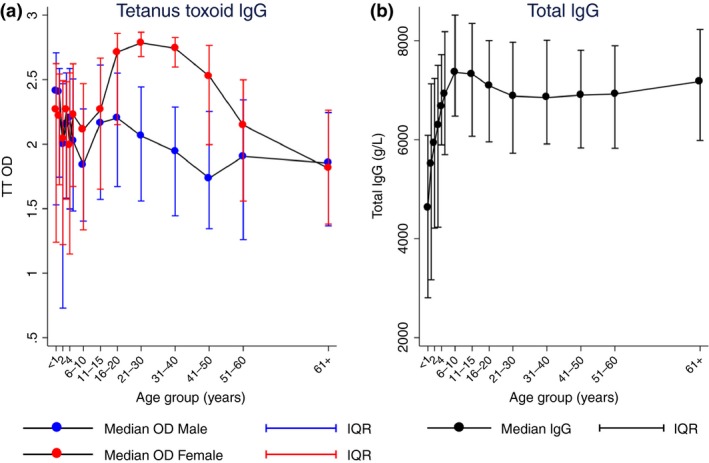
Figure 2.

(a) Median OD levels for TT IgG by sex and age group. (b) Median total IgG (g/l) by age group. Vertical lines show IQR for each median data point. Total n = 1988. Figure 2a red lines represent median values for females, blue lines for males. Figure 2(b) shows data for males and females combined. IQR, interquartile range, OD, optical density. [Colour figure can be viewed at wileyonlinelibrary.com]
