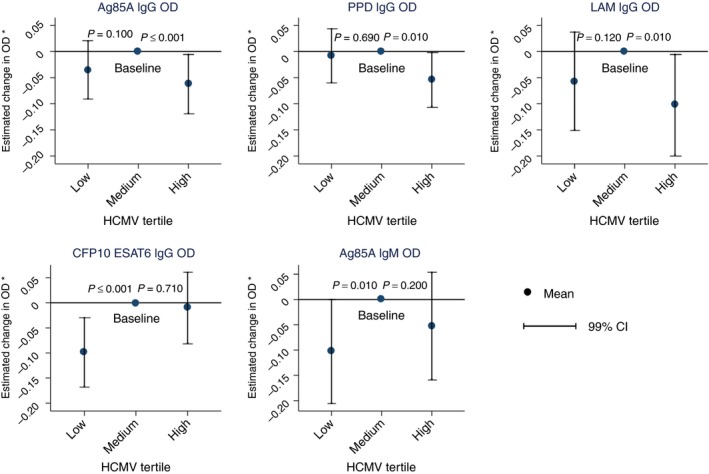
Figure 3.

Adjusted mean OD change associated with HCMV tertile comparing to medium HCMV tertile as baseline. P values from multivariable linear regression model including age, quadratic age, sex, HIV and TB. Total n = 1956. Vertical lines show 99% CI for each mean OD change. CI, confidence interval, OD, optical density (*model includes, age, quadratic age, sex, HIV and TB). [Colour figure can be viewed at wileyonlinelibrary.com]
