Figure 1.

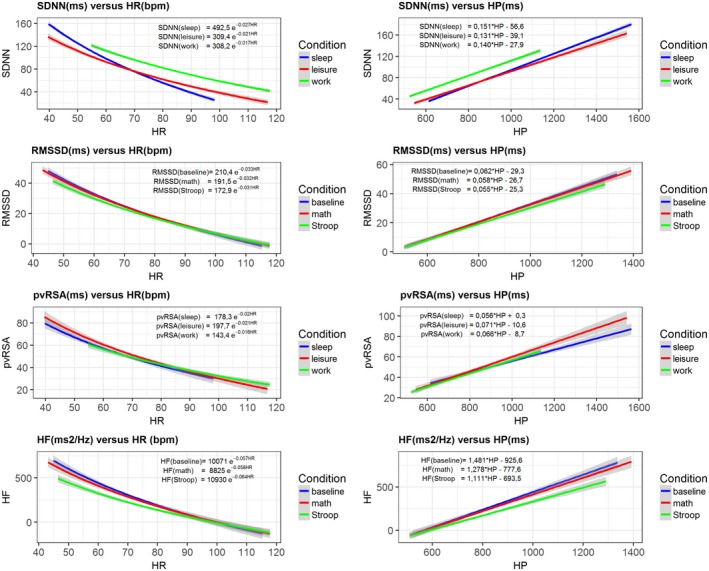
HRV metrics expressed as an exponential function of HR (bpm) and a linear function of IBI (ms). Data sources for SDNN and pvRSA are sleep (N = 1,320), leisure time (N = 1,277), and workday (N = 958) averages obtained from ambulatory recordings on participants from the Netherlands Twin Register (NTR). Data sources for RMSSD and HF are the baseline (N = 1,874), and math (N = 1,778) and Stroop (N = 1,794) condition averages from participants in the MIDUS II and Refresher Biomarker Studies. Left: Exponential fit (+ 95% CIs) of the HRV metrics against HR. Right: Linear fit (+ 95% CIs) of the HRV metrics against IBI
Figure 1.

HRV metrics expressed as an exponential function of HR (bpm) and a linear function of IBI (ms). Data sources for SDNN and pvRSA are sleep (N = 1,320), leisure time (N = 1,277), and workday (N = 958) averages obtained from ambulatory recordings on participants from the Netherlands Twin Register (NTR). Data sources for RMSSD and HF are the baseline (N = 1,874), and math (N = 1,778) and Stroop (N = 1,794) condition averages from participants in the MIDUS II and Refresher Biomarker Studies. Left: Exponential fit (+ 95% CIs) of the HRV metrics against HR. Right: Linear fit (+ 95% CIs) of the HRV metrics against IBI
