
Figure 1.
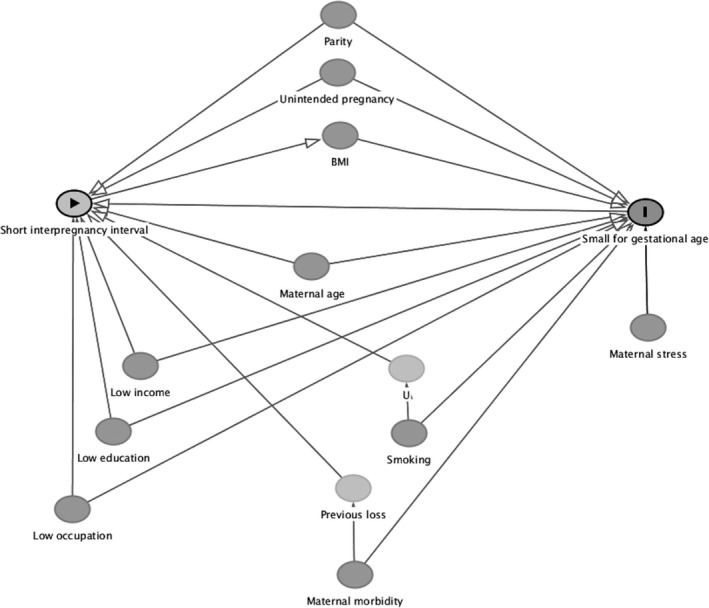
Directed acyclic graph representing the putative relationship between interpregnancy interval and SGA birth. Appendix A provides a rationale for the inclusion and inter‐relationships between variables
Official websites use .gov
A
.gov website belongs to an official
government organization in the United States.
Secure .gov websites use HTTPS
A lock (
) or https:// means you've safely
connected to the .gov website. Share sensitive
information only on official, secure websites.
Directed acyclic graph representing the putative relationship between interpregnancy interval and SGA birth. Appendix A provides a rationale for the inclusion and inter‐relationships between variables