Figure 2.

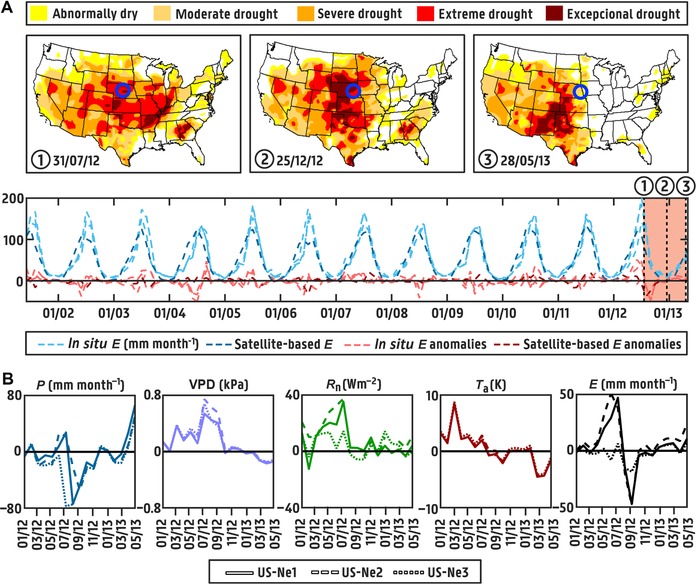
Evaporation during the 2012–13 Midwest drought. (A) Evolution of the event according to the U.S. Drought Monitor87 (top). Measurements of evaporation (mm month−1) at three eddy covariance cropland sites in Nebraska: US‐Ne1, US‐Ne2, and US‐Ne3 (bottom). The satellite data come from GLEAM v3.2a.66, 88 The blue circles in the maps mark the location of the eddy covariance sites. (B) Anomalies in precipitation (P, mm month−1), vapor pressure deficit (VPD, kPa), net radiation (R n, W m−2), air temperature (T a, K), and land evaporation (mm month−1) during the drought.
