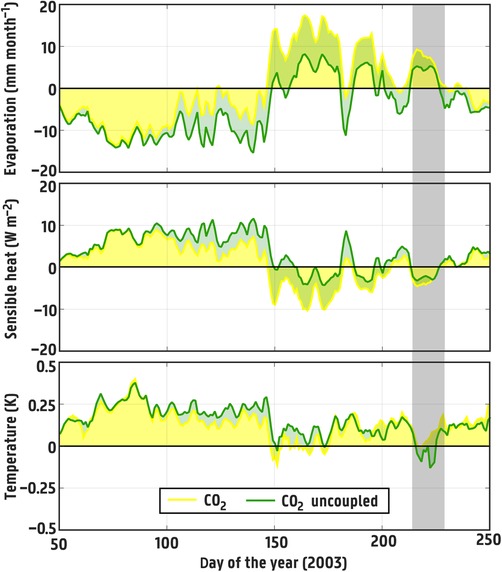
Figure 3.

CO2 effect on plant physiology and impact on the 2003 heatwave. Differences in evaporation (top), sensible heat flux (middle), and maximum daily air temperature (bottom) between considering the effects of CO2 on stomatal conductance and water use efficiency versus ignoring these effects (yellow lines and areas). The fraction of that effect that is purely physiological and does not relate to the cumulative impact of soil moisture savings due to the higher water use efficiency is depicted in green (lines and areas). For full details, see Lemordant et al.100
