
Figure 4.
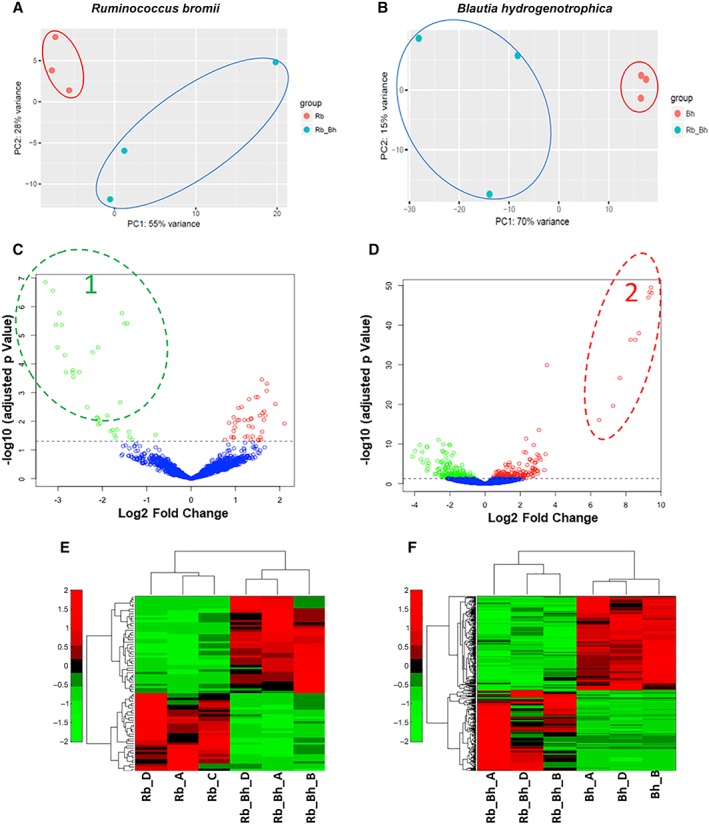
Principal‐component analysis, volcano plot and hierarchical cluster analysis of the RNA‐Seq samples examined in this study.
A and B. Principal‐component analysis of the RNA‐seq reads for the R. bromii and B. hydrogenotrophica monoculture and co‐culture experiments, comparing all RNA‐Seq samples analysed. Red circles show monoculture, whereas blue circle shows co‐culture samples. (A) R. bromii and (B) B. hydrogenotrophica. (c and d) Volcano plots showing fold change and levels of significance for differential expression for all genes. The up and down regulated genes (based on an adjusted p < 0.05) are shown in red and green respectively and the genes with no change are shown in blue. C. R. bromii and (D) B. hydrogenotrophica. E and F. Heat maps showing expression of differentially expressed genes in R. bromii and B. hydrogenotrophica. Red shows high expression and green shows low expression. (E) R. bromii and (F) B. hydrogenotrophica.