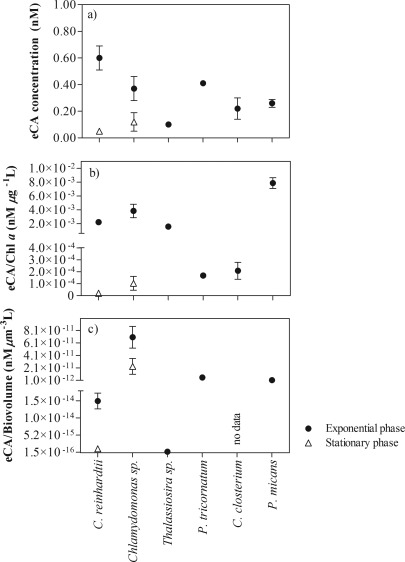
Figure 9.

Concentration of eCA extracted from C. reinhardtii, Chlamydomonas sp., Thalassiosira sp., P. tricornutum, P. micans, and C. closterium during the exponential and stationary growth phases. The concentrations of eCA are shown as (a) absolute concentrations, (b) concentrations of eCA per μg Chl a per L and (c) concentrations of eCA per unit of phytoplankton biovolume (μm3•L−1). Values represent the means of triplicate cultures, and error bars represent the standard deviation (± SD).
