
Figure 10.
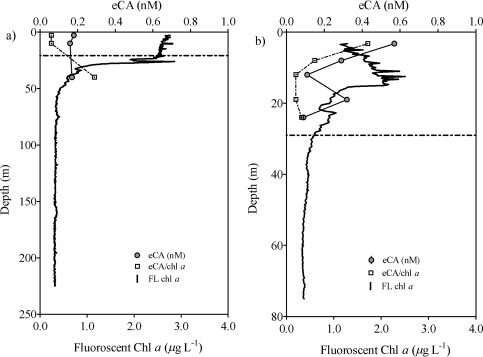
Depth profiles of eCA concentrations, fluorescent Chl a (FL Chl a) and the eCA/FL Chl a ratio in samples collected from the Baltic Sea. (a) Profile 1 (30th July 2015) and (b) Profile 2 (14th August 2015). The dotted line represents mixed layer depth.