Figure 1.

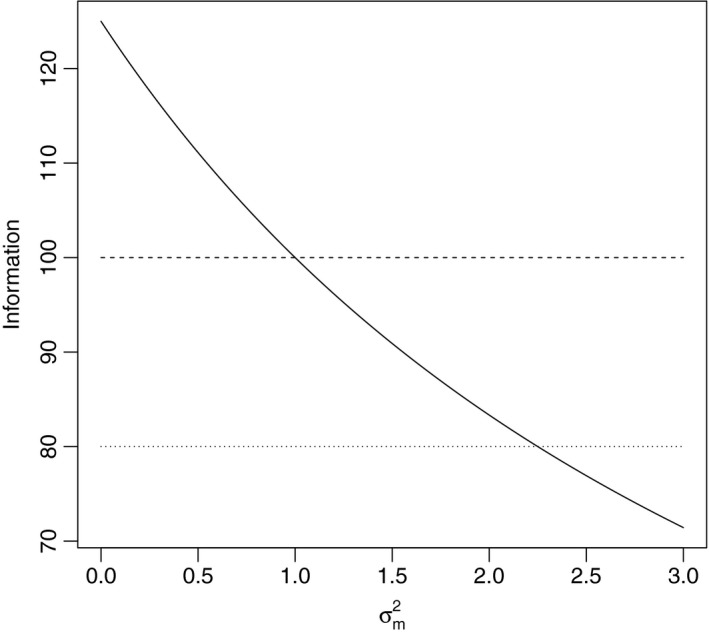
Information about the sample mean varies with :  , sensitivity analysis information;
  , full data information;
  , observed data information

Information about the sample mean varies with :  , sensitivity analysis information;
  , full data information;
  , observed data information