
Figure 2.
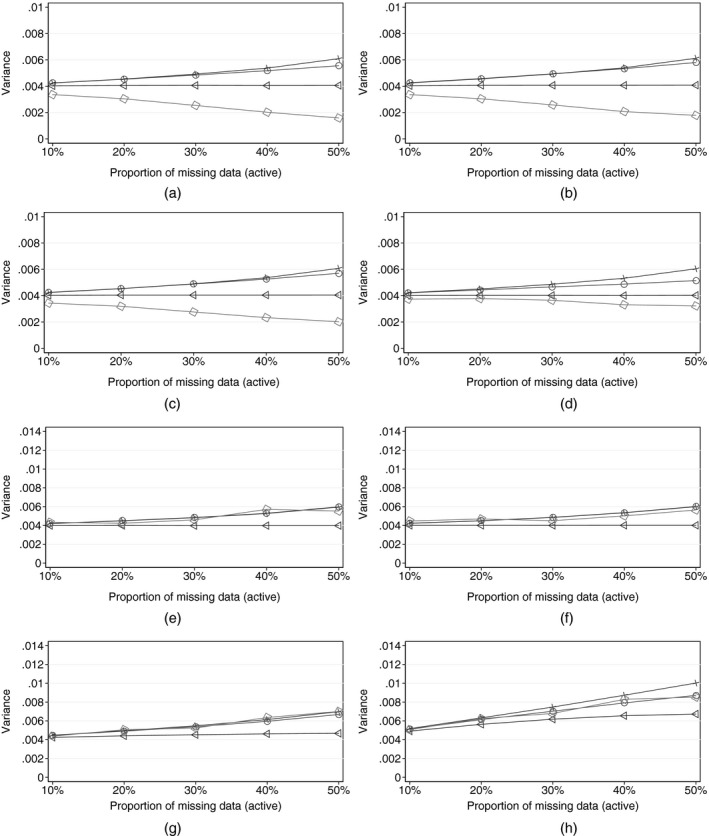
Simulation results (for each sensitivity scenario, as the proportion of active arm deviations increases, each panel shows the evolution of the mean estimate of the time 3 treatment effect variance (over 1000 replications) calculated in four ways:  , Rubin's multiple‐imputation variance, from reference‐ or δ‐based multiple imputation;
  , information‐anchored variance ();
  , applying the primary analysis variance estimator in sensitivity scenarios;
  , variance when post‐deviation data are actually fully observed under the given scenario ()): (a) sensitivity scenario, copy reference; (b) sensitivity scenario, jump to reference; (c) sensitivity scenario, copy increments in reference; (d) sensitivity scenario, last mean carried forward; (e) sensitivity scenario, δ‐method, with δ=0 (MAR); (f) sensitivity scenario, δ‐method, with δ=−0.1; (g) sensitivity scenario, δ‐method, with δ=−0.5; (h) sensitivity scenario, δ‐method, with δ=−1.0