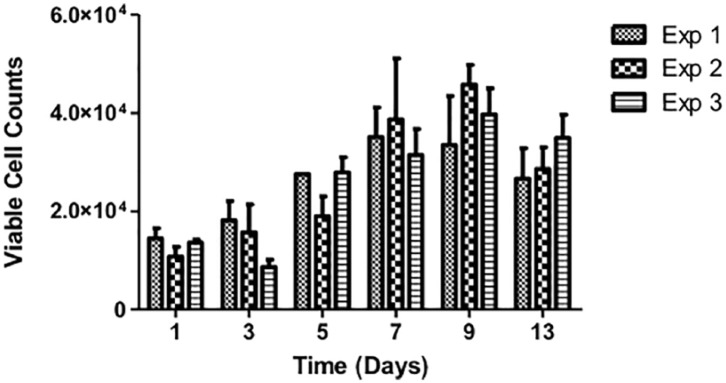
Figure 3.
Growth profile of MG63 proliferation cultured on Ti 5 mol% under static conditions over 13 days where Exp 1, 2 and 3 denote three different static runs which were used as controls carried out in parallel with the dynamic studies (150 and 300 rpm). Exp 1: static only; Exp 2: static control for 150 rpm study; Exp 3: static control for 300 rpm study. Values represent mean ± SD (n = 3).

