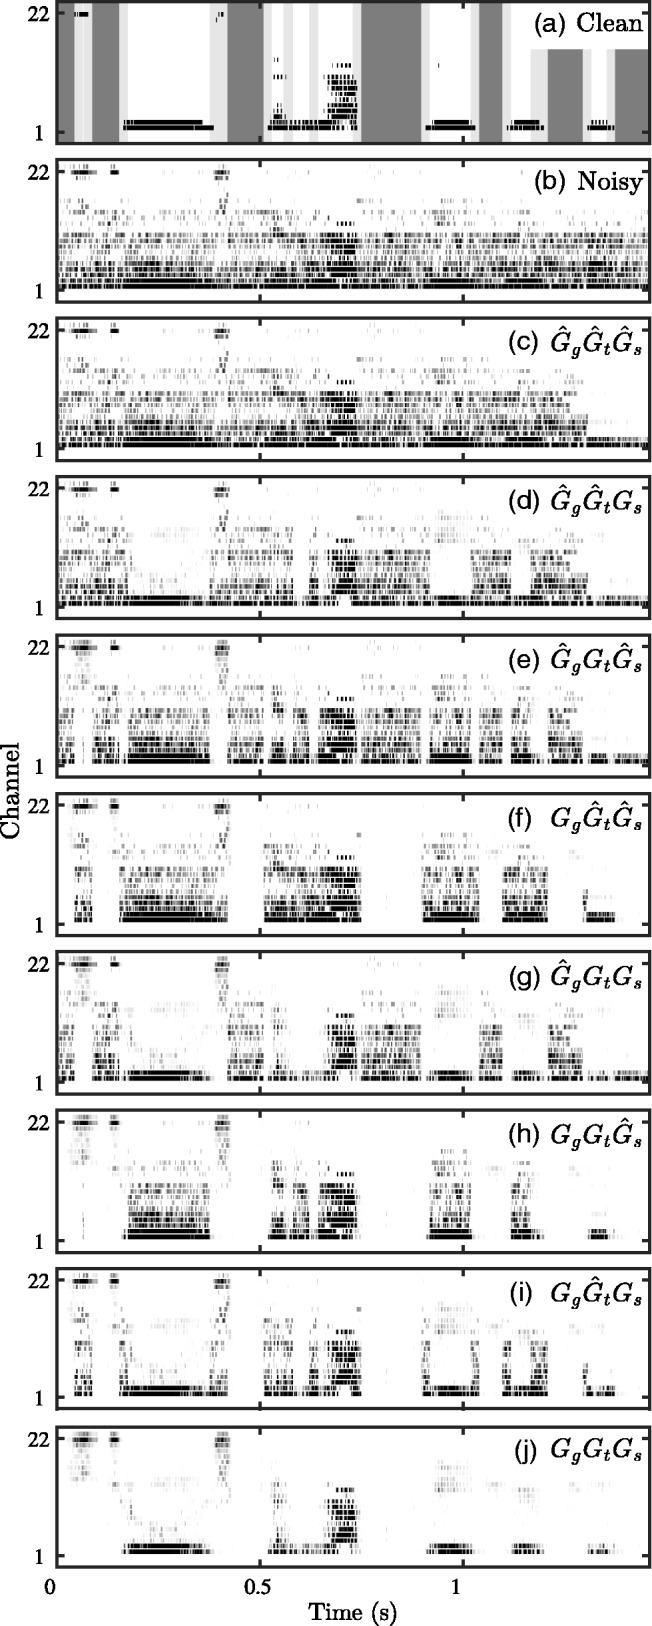
Figure 1.

(a) Electrodogram showing stimulation levels above threshold for a clean sentence. Speech segments, transitions, and gaps are identified by the white, light gray, and dark gray shading, respectively. (b to j) Electrodograms showing unthresholded levels for the same sentence mixed with speech-shaped noise at 0 dB and then denoised using the indicated gain matrix, where indicates the use of nonideal gains in the gap, transition, and speech regions, respectively; indicates the use of nonideal gains in the gap and transition regions but ideal gains in the speech regions, and so forth.
