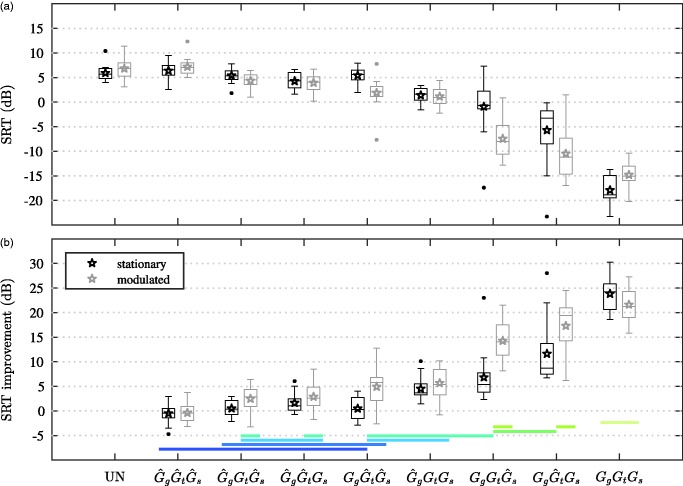
Figure 3.
(a) SRT and (b) SRT improvements relative to the reference condition (UN). Means are marked with stars. Boxplots show the 25th, 50th, and 75th percentiles, together with whiskers that extend to cover all data points not considered outliers. Outliers are marked with circles. SRT improvements that were not significantly different from one another (α = .05) are grouped via colored, horizontal lines at the bottom of the plot. The condition labels along the abscissa are defined in the text, as well as in the caption of Figure 1.
SRTs = speech reception thresholds; UN = unprocessed noisy speech.

