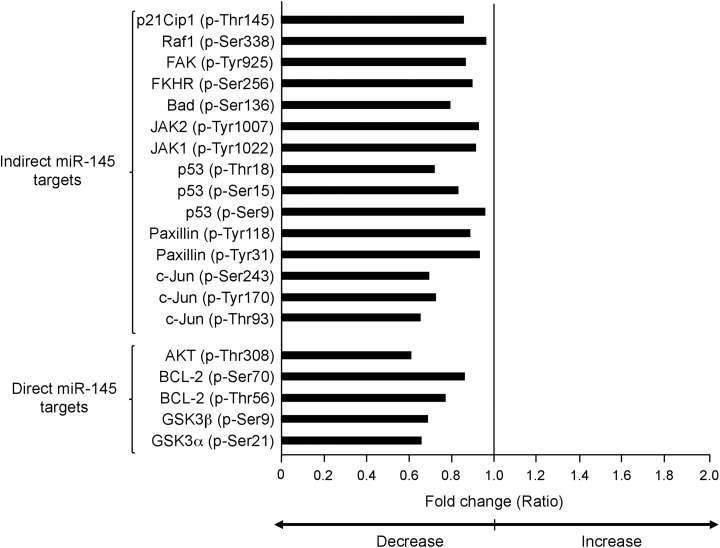
Figure 3.
Protein levels and phosphorylation status of 12 signaling proteins in MDA-MB-231 cells expressing miR-143. Graph indicates the decrease (<1; P < .05 vs control) in phosphorylation status of signaling transducers in MDA-MB-231 cells transfected with miR-143 mimics (60 nM) by 48 hours in comparison to nontransfected control cells. Direct and indirect targets of miR-143 are indicated with brackets.

