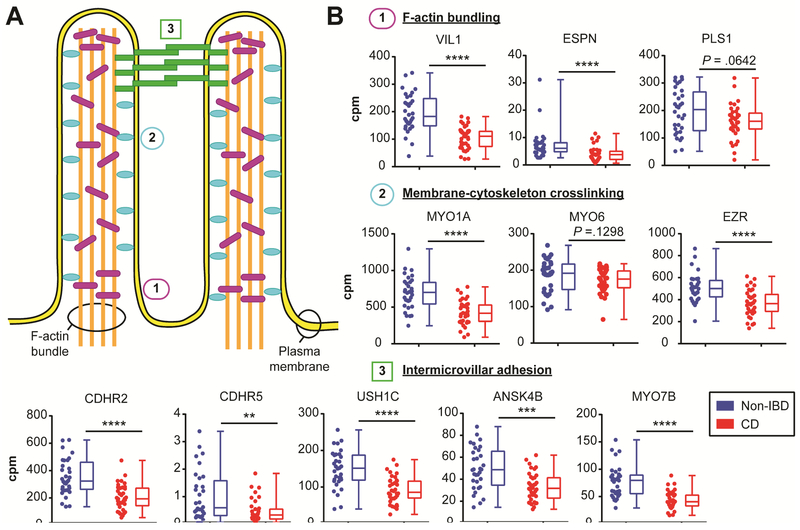
Figure 2. Decreased expression of genes related to microvilli formation in CD intestine.
(A) Schematic of intestinal microvilli structure highlighting the F-actin bundling components (1; purple rods), membrane-cytoskeleton crosslinking (2; blue ovals), and intermicrovillar adhesion complex (3; green rectangles). (B) Graphs of RNA-seq gene expression levels displayed as counts per million (cpm) for the indicated microvilli component genes. The same data is displayed side-by-side as scatterplots and box-and-whiskers plots for CD (n=36; red) and Non-IBD (n=32; blue). **P <.01, ***P <.001, ****p <.0001 by unpaired twotailed Mann-Whitney t-test. The exact P-value is indicated for non-significant comparisons.

