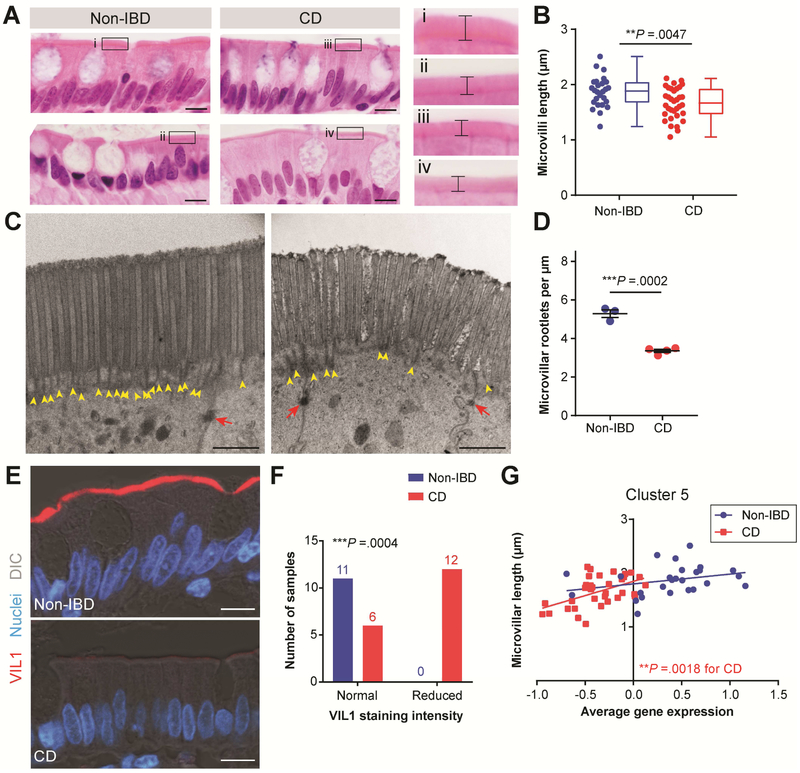
Figure 3. Decreased microvilli length in CD correlates with Cluster 5 average gene expression.
(A) Representative images of H&E-stained ileal tissue regions used to measure microvilli length. Bars, 10 μm. A magnified view of the boxed region in each image is shown to the right; brackets indicate microvilli length. (B) Graph of average microvilli length (μm) with the same data displayed side-by-side as scatterplots and as box-and-whisker plots for Non-IBD (n=26; blue) and CD (n=34; red) samples. **P =.0047 by unpaired two-tailed Mann-Whitney t-test. (C, D) TEM images of enterocytes captured from the upper portion of villi from Non-IBD (n=3) and CD (n=4) samples. (C) Representative images of the epithelial apical surface. Yellow arrowheads designate rootlet ends and red arrows designate desmosomes. Bars, 1 μm. (D) Graph of average microvilli rootlet densities quantified from TEM images and displayed as mean ± s.e.m. ***P =.0002 by unpaired two-tailed parametric t test. (E) Representative confocal images of Non-IBD and CD intestinal epithelial cells co-stained for VIL1 (red). Nuclei are visualized with bisbenzimide (blue). Tissue structure is visualized with a DIC image overlay (gray). Bars, 10 μm. (F) Contingency graph of Non-IBD and CD samples with normal or reduced VIL1 staining intensity. ***P =.0004 by Fisher’s exact test comparing Non-IBD and CD (sample size is indicated above bars). (G) X-Y graph of average microvilli length and Cluster 5 average normalized gene expression for the samples in (B). CD: **P =.0018 and r2=.2666 and Non-IBD: P =.1444 (not significant) and r2=.0866 by linear regression.

