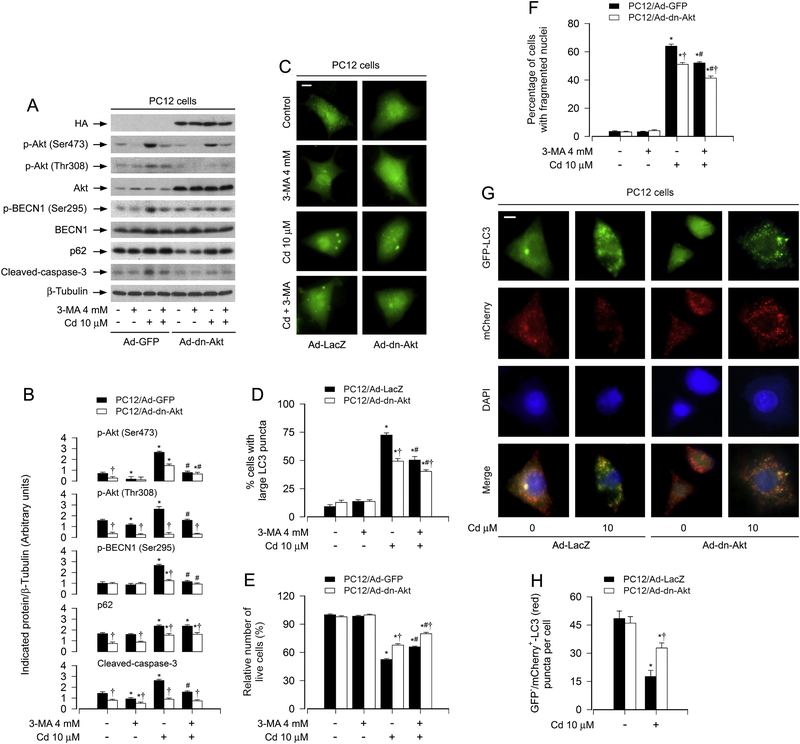
Fig. 8.
Expression of dominant negative Akt attenuates Cd-blocked autophagic flux and autophagosome-dependent neuronal apoptosis. PC12 cells, infected with Ad-dn-Akt or Ad-GFP (as control) and/or infected with Ad-mCherry-GFP-LC3, respectively, were exposed to Cd (10 μM) for 12 h (for mCherry-GFP-LC3 assay), or pretreated with/without 3-MA (4 mM) for 1 h and then exposed to Cd (10 μM) for 8 h (for Western blotting), 12 h (MDC staining) and 24 h (for DAPI staining). (A) Total cell lysates were subjected to Western blotting using indicated antibodies. The blots were probed for β-tubulin as a loading control. Similar results were observed in at least three independent experiments. (B) The blots for p-Akt (Ser473), p-Akt (Thr308), p-BECN1 (Ser295), p62, cleaved-caspase-3 were semi-quantified. (C and D) Overlay of large LC3 puncta (in green) was shown (C) and the ratio of cells with large LC3 punctate structures was counted and calculated (D). Scale bar: 2 μm. (E) Live cells were detected by counting viable cells using trypan blue exclusion. (F) Apoptotic cells were evaluated by nuclear fragmentation and condensation using DAPI staining. (G) Co-localization of both GFP and mCherry fluorescence for GFP+/mCherry+-LC3 (yellow) and GFP–/mCherry+-LC3 (red) puncta was shown in the cells. Scale bar: 2 μm. (H) GFP–/mCherry+-LC3 puncta per cell was quantified. For (B), (D), (E), (F) and (H), all data were expressed as means ± SE (n = 3–5). *P < 0.05, difference with control group; #P < 0.05, difference with 10 μM Cd group; †P < 0.05, Ad-dn-Akt group versus Ad-LacZ or Ad-GFP group.

