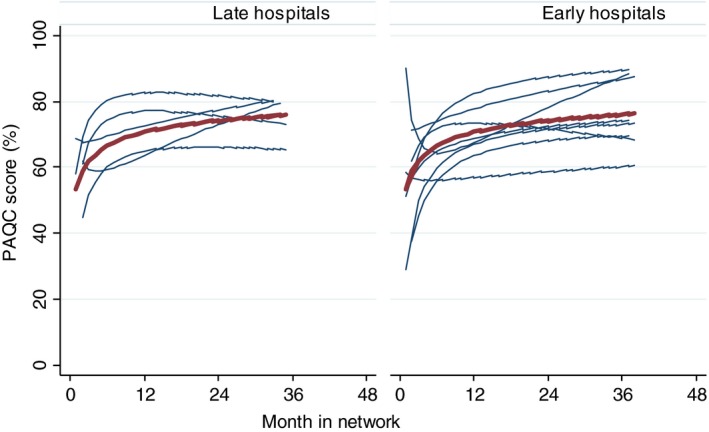
Figure 2.

Predicted Paediatric Admission Quality of Care (PAQC) scores over time. Footnote: Left panel shows results for early entry hospitals (‘early hospitals’) and right panel shows results for late entry hospital (‘late hospitals’) Red line shows mean prediction assuming random effects equal to zero. The following mixed effects fractional polynomial model was fitted; paqc_score = 69.6 + 5.8 ln(duration_in_study/10)–0.6 ln2(duration_in_study/10) using this Stata command ‘fp <duration_in_study>, scale: xtmixed paqc_score <duration_in_study> || hospitalID: <duration_in_study>‘. [Colour figure can be viewed at wileyonlinelibrary.com]
