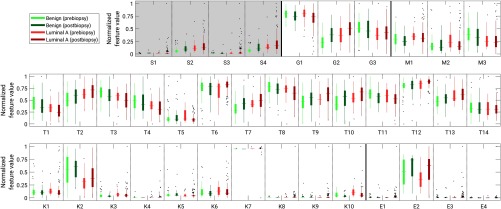
Fig. 5.
Box plots of normalized feature values for benign (green bars) and luminal A lesions (red bars) from DCE-MR image series acquired either pre- or postbiopsy. The horizontal lines within the boxes indicate the median of a set, while the edges of the boxes indicate the 25th and 75th percentiles. The thin vertical lines for each box indicate the range of data values that are not considered outliers. The dots indicate outliers. Dashed vertical lines are drawn to separate each set of four groups of features by lesion status and biopsy conditions for a given feature, while solid vertical lines are drawn to indicate groups of features by category. Normalized values for size features are shown within a shaded box but were not included in statistical analysis. (S, size features; G, shape features; M, morphology features; T, enhancement texture features; K, kinetic curve assessment features; E, enhancement-variance kinetics). Full feature names are given in Table 2.

