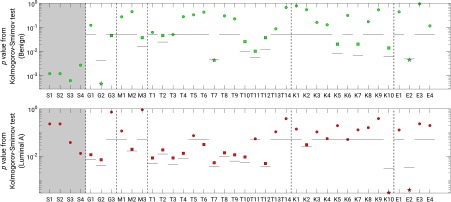
Fig. 6.
-values for the Kolmogorov–Smirnov test comparing the distributions of extracted feature values for benign (green) and luminal A lesions (red) by biopsy condition. The solid horizontal lines indicate the significance level each feature, for and otherwise according to the Bonferroni–Holm correction for multiple comparisons. Squares indicate a feature for which according to the Kolmogorov–Smirnov test but there was failure to demonstrate significant difference after correction for multiple comparisons. Stars indicate features for which a statistically significant difference was observed. Size features are shown within a shaded box but were not included in statistical analysis. Full feature names are given in Table 2.

