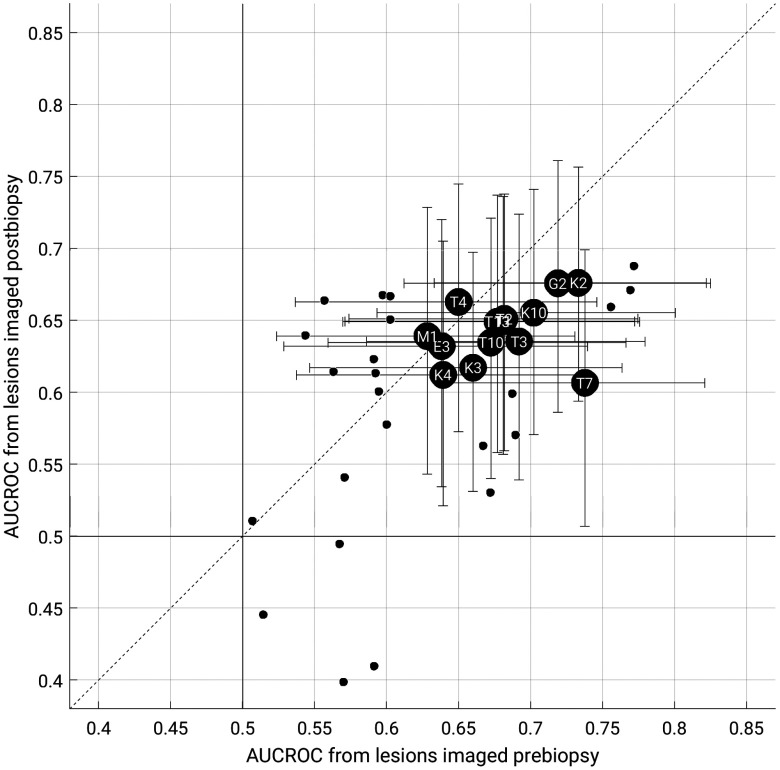
Fig. 7.
AUCROC for features extracted from images acquired postbiopsy versus those extracted from images acquired prebiopsy, in the task of distinguishing between benign lesions and luminal A breast cancers. The data points indicate the median value (2000 bootstrap iterations). Large black circles with feature abbreviations represent those that outperformed random guessing for both biopsy conditions. The data points for T1, T2, and T13 overlap in the figure. Error bars represent 95% confidence intervals. Small circles represent features which did not outperform random guessing for both biopsy conditions, and their error bars are not shown for figure clarity. The solid vertical and horizontal lines indicate (random guessing). Full feature names are given in Table 2.

