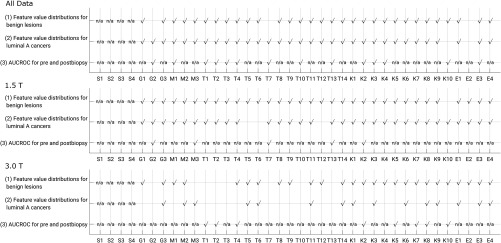
Fig. 8.
Summary of statistical test results. Each comparison is made for groups of lesions by biopsy status. For each set, a check mark indicates that the feature distributions (rows 1 and 2) or difference in AUCROC (row 3) failed to demonstrate a statistically significant difference, and thus the feature may be robust. For the null-hypothesis for AUCROC comparison, only features with both for both biopsy conditions were assessed. Full feature names are given in Table 2.

