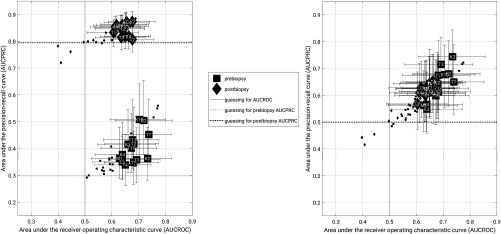
Fig. 9.
Classification performance in terms of AUCPRC versus AUCROC for (a) the full data set and (b) a subset of the data matched for prevalence during bootstrapping. The data points indicate the median value (2000 bootstrap iterations). The error bars represent the 95% confidence intervals. In each figure, squares represent prebiopsy lesions and diamonds represent postbiopsy lesions. The large, labeled data points represent features which performed better than random guessing according to AUCROC, while small, unlabeled points represent the remaining features and are shown for completeness. In (a), dotted and dashed horizontal lines represent baseline (e.g., random guessing) for AUCPRC in the prebiopsy and postbiopsy groups, respectively. In each figure, the vertical line represents random guessing for AUCROC. In (b), the baseline for each group is the same (0.5) and thus the horizontal lines overlap.

