
Fig. 2.
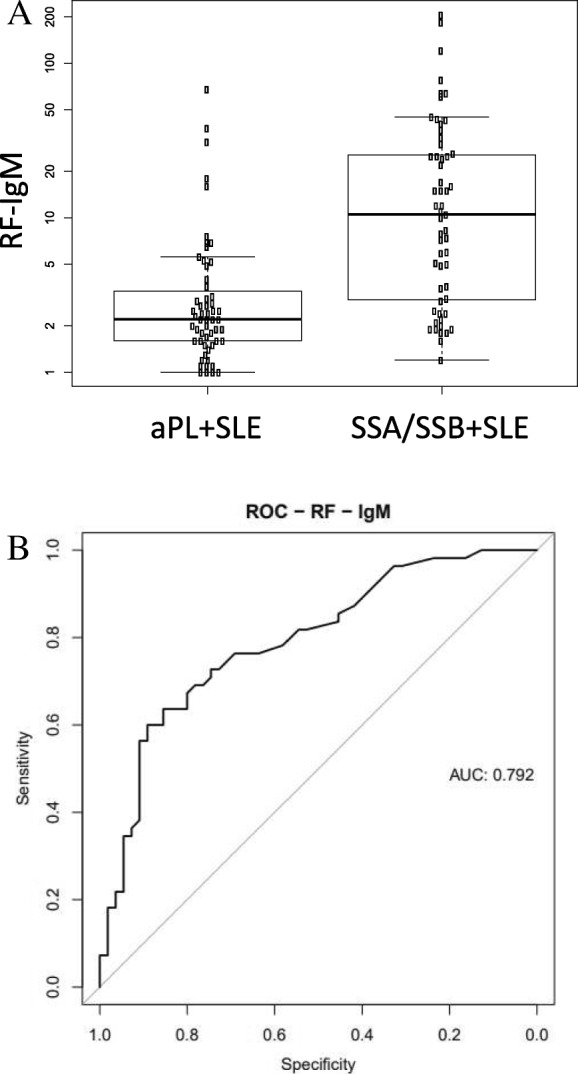
RF-IgM were found to be significantly increased in the SSA/SSB+ SLE subgroup compared to aPL+ subgroup (p = 1.3E-7). The levels of RF-IgM comparing the two subgroups are shown in (a), and the ROC curve are shown in (b) with an AUC of 0.79
Official websites use .gov
A
.gov website belongs to an official
government organization in the United States.
Secure .gov websites use HTTPS
A lock (
) or https:// means you've safely
connected to the .gov website. Share sensitive
information only on official, secure websites.
RF-IgM were found to be significantly increased in the SSA/SSB+ SLE subgroup compared to aPL+ subgroup (p = 1.3E-7). The levels of RF-IgM comparing the two subgroups are shown in (a), and the ROC curve are shown in (b) with an AUC of 0.79