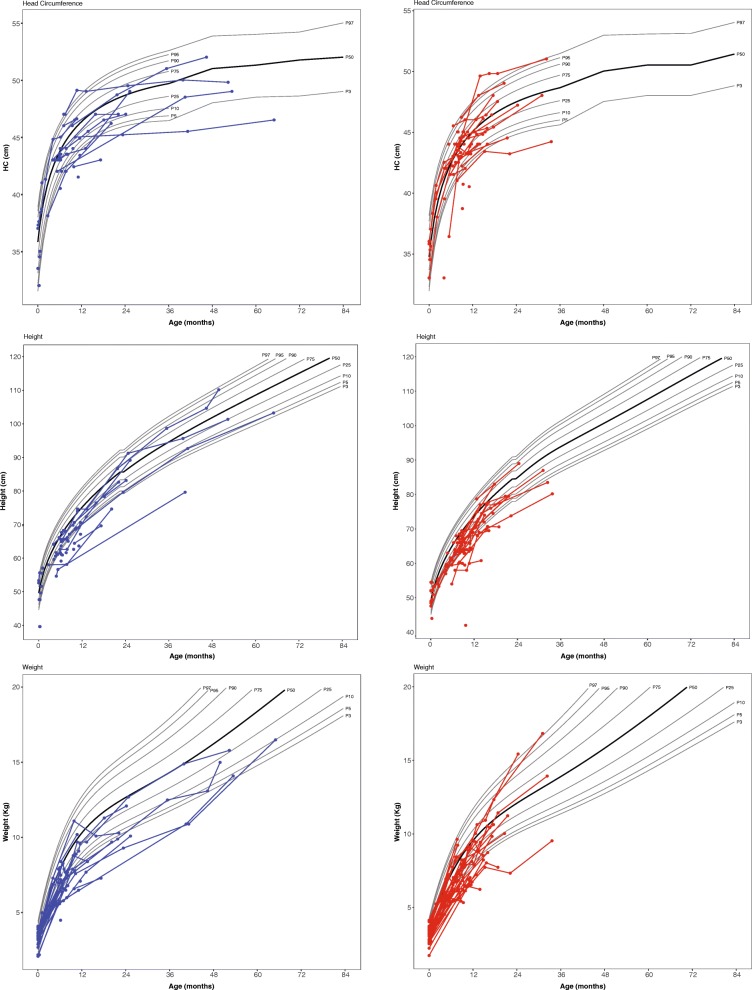
Fig. 2.
Height, weight, and head circumference of boys (blue) and girls (red) with Krabbe disease. Each circle depicts an individual measurement; lines connecting circles show multiple measurements for an individual child. The gray lines represent standard growth curves (gray lines = 3rd, 5th, 10th, 25th, 50th, 75th, 90th, 95th, and 97th percentiles)

