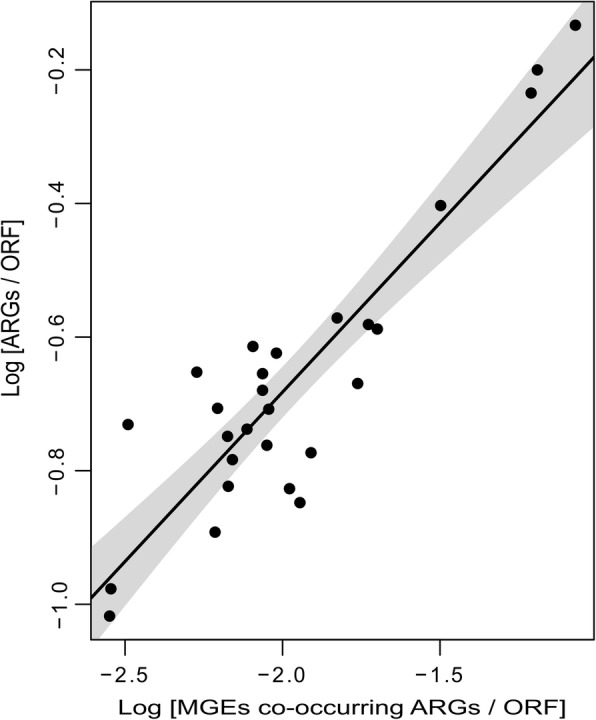
Fig. 5.

Positive correlation between MGEs co-occurring with ARGs and the total ARGs. Correlation of the log-transformed relative abundance of MGEs co-occurring with ARGs and the total ARGs from the gut of Piaratus mesopotamicus before, during, and after the antibiotic exposure. The black line indicates the regression model and the grey area correspond to the 95% confidence interval. Spearman’s correlation = 0.69, S = 1006, P = 9.4 × 10−05. This result was corroborated using a bootstrap Spearman’s correlation (Spearman’s correlation = 0.69, bootstrap = 2000, bias = − 0.011, std. err = 0.14, Percentile interval 95% = 0.341–0.897)
