Fig. 9.
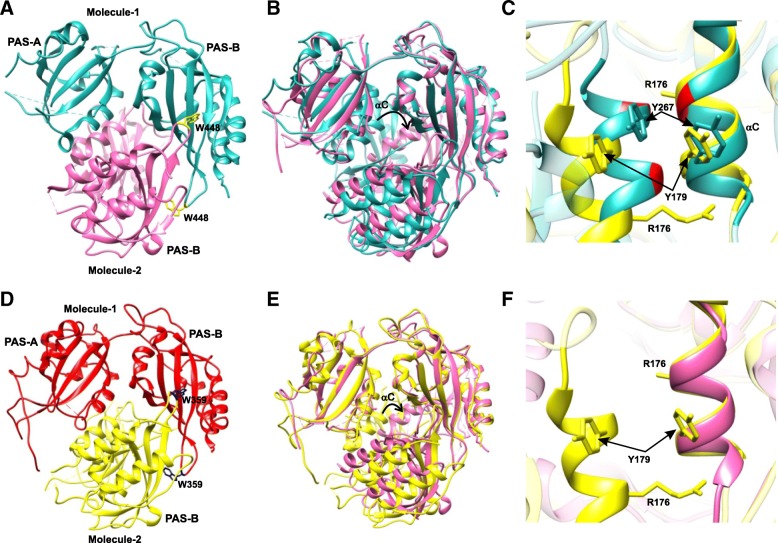
Crystal structures of mPER1 (PDB 4DJ2) and mPER3 (PDB 4DJ3) fragments. a Cartoon representation of mPER1 (residues 191–502). The conserved Trp448 (yellow) is shown in stick representation. b Comparison of the mPER1 (cyan) and mPER2 (pink) crystal structures. Movement of the PAS-A/αC helix of molecule 2 is indicated by a black arrow. c Closeup view of the structural comparison of the PAS-A/αC dimer interface of mPER1 (cyan) and mPER3 (yellow). Gly residues in mPER1 are shown in red and Arg residues in mPER3 are labeled. d Cartoon representation of mPER3 (108–411). The conserved Trp359 (blue) is shown in stick representation. e Comparison of the mPER3 (yellow) and mPER2 (pink) crystal structures. The black arrow indicates the location of movement of the PAS-A/αC helix of molecule 2. f Closeup view of the structural comparison of the PAS-A/αC dimer interface of mPER2 (pink) and mPER3 (yellow). PAS-A/αC dimer interaction is present in mPER1 and mPER3, but absent in mPER2, because of the different relative orientation of the monomers in (mPER2)2 compared to the mPER1 and mPER3 homologues

