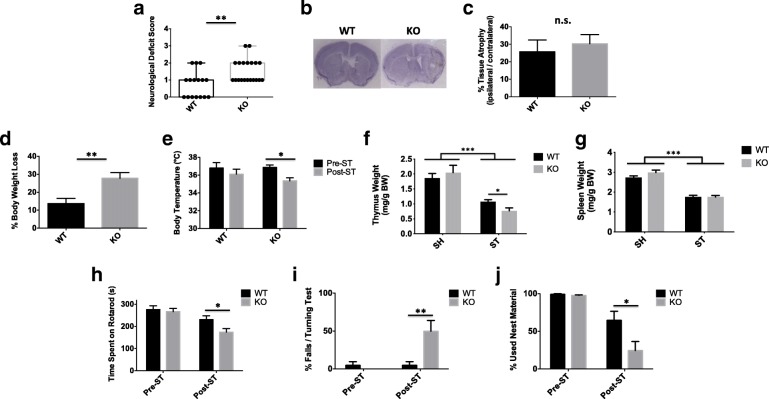
Fig. 3.
CD200R1-KO mice exhibit significantly worse functional outcomes at 1 week after stroke. Neurological deficit scores were assessed for each group at 7 days (a; N = 16–20/group). Representative images of Cresyl violet-stained coronal brain sections for CD200R1-KO and WT control littermates at 7 days after 60 min of middle cerebral artery occlusion (b). Tissue atrophy was measured for the total ipsilateral hemispheric area relative to the contralateral side (c; N = 8/group). The percentage of body weight loss is shown (d). Core body temperatures were measured (e), and spleen (g) and thymus (f) weights were normalized to body weight at 7 days (respectively N = 5 SH/group and N = 12–14 ST/group). The latency to fall on an accelerated rotarod device was recorded (h). CD200R1-KO mice displayed a significantly greater percentage of falls in a 180° turning test compared to WT controls (i). Nesting behavior was measured at day 7, and the percentages of used nest material are shown (j). For all behavior experiments, N = 12–14 mice per group. Error bars show mean SEM. Asterisks adjacent to group labels designate an effect of stroke by two-way ANOVA. KO knockout, WT wild-type, g grams, s seconds, BW body weight, SH sham, ST stroke, SEM standard error of mean. *p < 0.05; **p < 0.01

