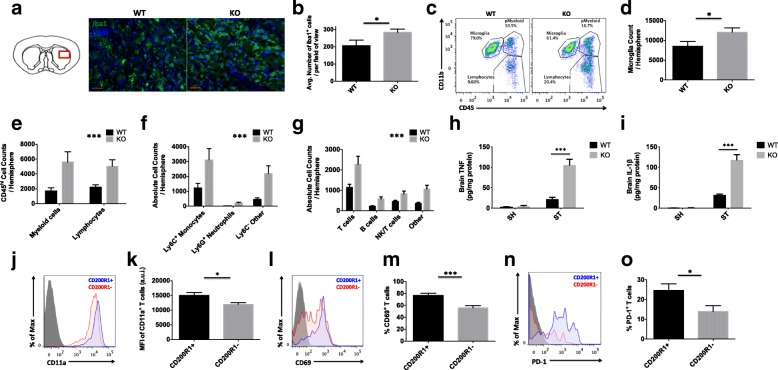
Fig. 4.
CD200R1-deficient mice demonstrate an inability to resolve neuroinflammation 1 week after ischemia. The inset of the diagram illustrates the striatal region bordering the penumbral zone from which the following representative histological sections were taken (a; scale bar = 50 μm). Sections were stained with the microglia/macrophage marker, anti-ionized calcium-binding adaptor molecule 1 (Iba1; in green), and the nuclear/DNA marker 4′,6-diamidino-2-phenylindole (DAPI; in blue). The average number of co-labeled Iba1+ microglia/macrophages in the region of interest was quantified for all sections (b; N = 8/group). Representative dot plots show greater numbers of CD45+CD11b+ and CD45hiCD11b− leukocytes in the ischemic hemisphere of CD200R1-KO mice compared to WT controls at 7 days (c). The absolute number of CD45intCD11b+Ly6C− microglia (d) and infiltrating CD45hi myeloid and lymphocyte populations (e) was quantified (N = 13/group). A more detailed phenotypic analysis was performed to identify the specific myeloid (monocytes: CD45hiCD11b+Ly6C+Ly6G−; neutrophils: CD45hiCD11b+Ly6C+Ly6G+; other: CD45hiCD11b+Ly6C−Ly6G−) and lymphocyte (T cells: CD45hiCD11b−CD19−CD3+; B cells: CD45hiCD11b−CD3−CD19+MHCII+; NK/T cells: CD45hiCD11b−CD19−NKp46+DX5+; other: CD45hiCD11b−CD19−CD3−NKp46−DX5−) subsets in the ischemic brain (f and g, respectively). Brain concentrations of TNF-α and IL-1β in sham and stroke mice are shown (f; N = 4–5/group). CD200R1-positive CD3+ T cells in the ischemic brain express a higher percentage of T cell activation markers CD11a (j, k), CD69 (l, m), and PD-1 (n, o) compared to their CD200R1-negative counterparts (N = 12/group). FMO controls were used to determine positive gating. Asterisks adjacent to group labels designate an effect of genotype by two-way ANOVA. Error bars show mean SEM. KO knockout, WT wild-type, SEM standard error of mean. *p < 0.05; **p < 0.01; ***p < 0.001

