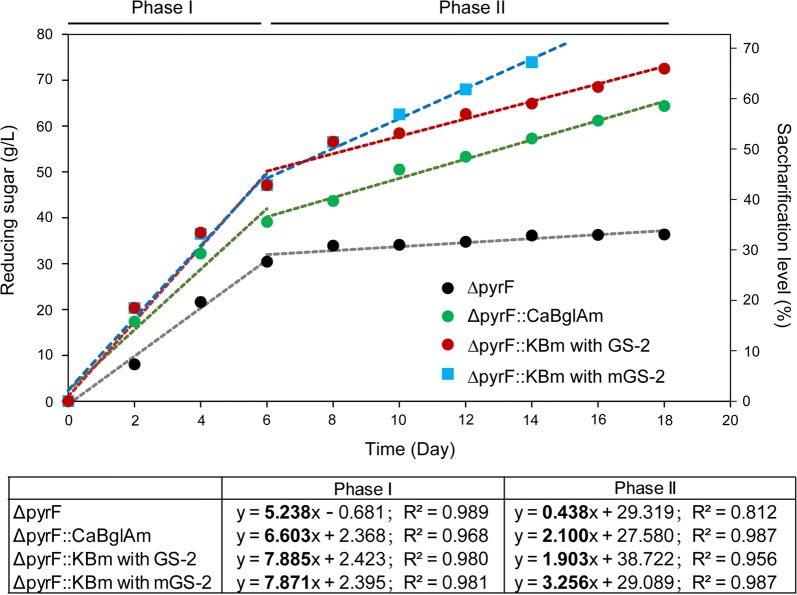
Fig. 2.
Cellulose saccharification of C. thermocellum strains with 100 g/L Avicel as the substrate. The Avicel saccharification of ΔpyrF::CaBglAm and ΔpyrF was performed in GS-2 medium. Both GS-2 and the modified medium mGS-2 were used for the saccharification of ∆pyrF::KBm. The inoculum size was 10%. The saccharification level was calculated by dividing the initial cellulose in the substrate (~ 110 g/L in glucose equivalence) with the amount of the obtained reducing sugar, which was determined by the DNS method. The saccharification process could be divided into two phases before and after the 6th day. The linear trend lines were calculated for both Phase I and II, and the slope (in bold) and R2 values are shown in the table. The slope values of the trend lines stand for the sugar production rates (g/L/day). Three independent experiments were performed for every strain to calculate the average values and standard errors

