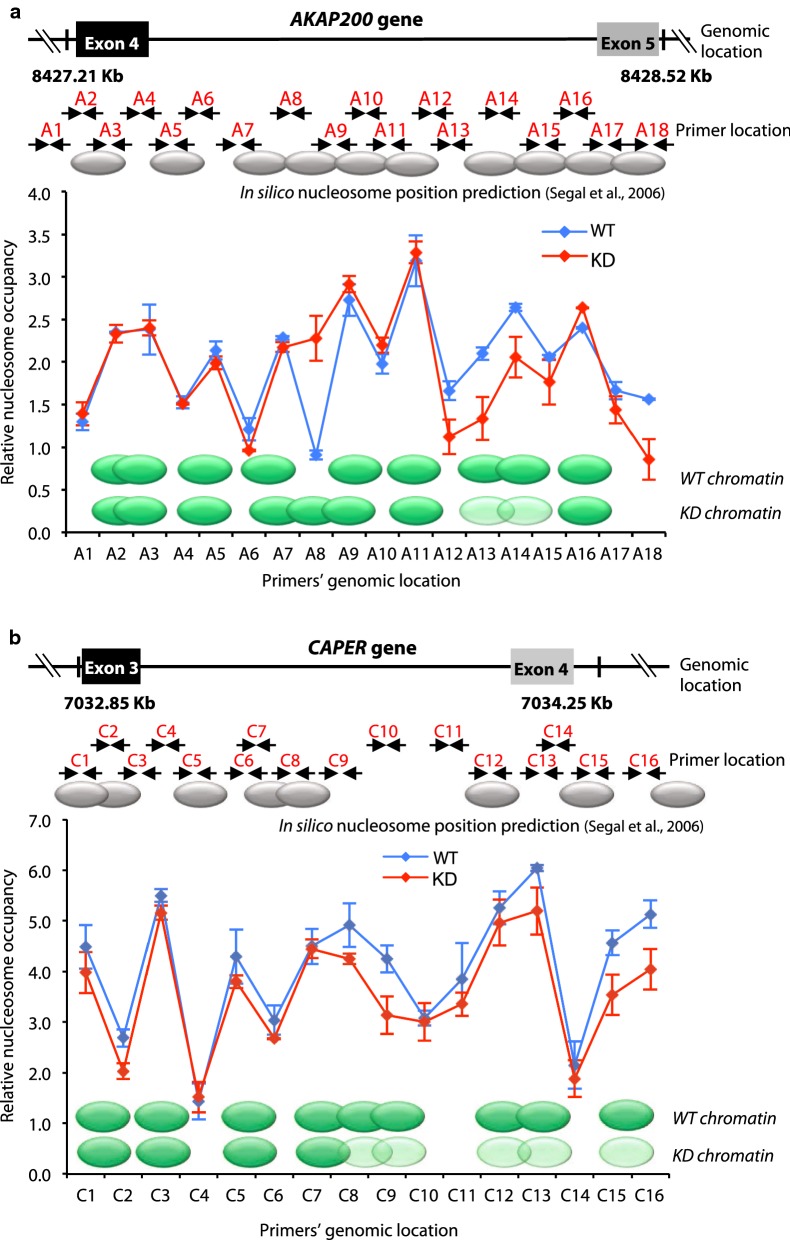
Fig. 3.
Analysis of nucleosome architecture. The positions of nucleosomes in non-treated cells (WT, blue line) versus PARP1 knockdown (KD, red line) for the AKAP200 (a) and CAPER (b) genes are distinctive. For each gene, the top panel shows gene region and the predicted nucleosome location (gray ovals) based on sequence alone [34]. The bottom panel demonstrates the nucleosome position and occupancy (green ovals) obtained by nucleosome scanning analysis (see Methods). Depletion of PARP1 shifts nucleosome positioning and occupancy. Light green ovals depict reduction in nucleosome occupancy, while fuzzy nucleosomes are represented as nucleosomes overlying each other. All experiments were done in triplicate, and results are presented as mean ± SD (results were considered significant as determined by Student’s t test method: p value < 0.05)

