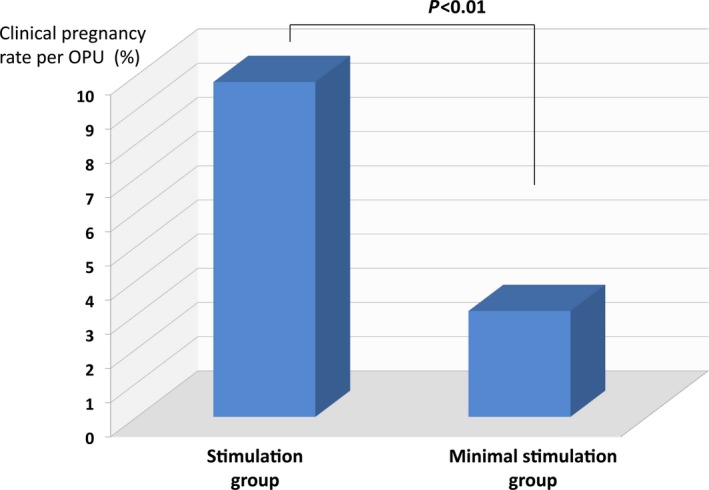
Figure 1.

This graph indicates the clinical pregnancy rates per oocyte pickup in the stimulation and minimal stimulation groups. The rate in the stimulation group was 9.8% and was significantly higher than that in the minimal stimulation group (3.1%, P < 0.01)
