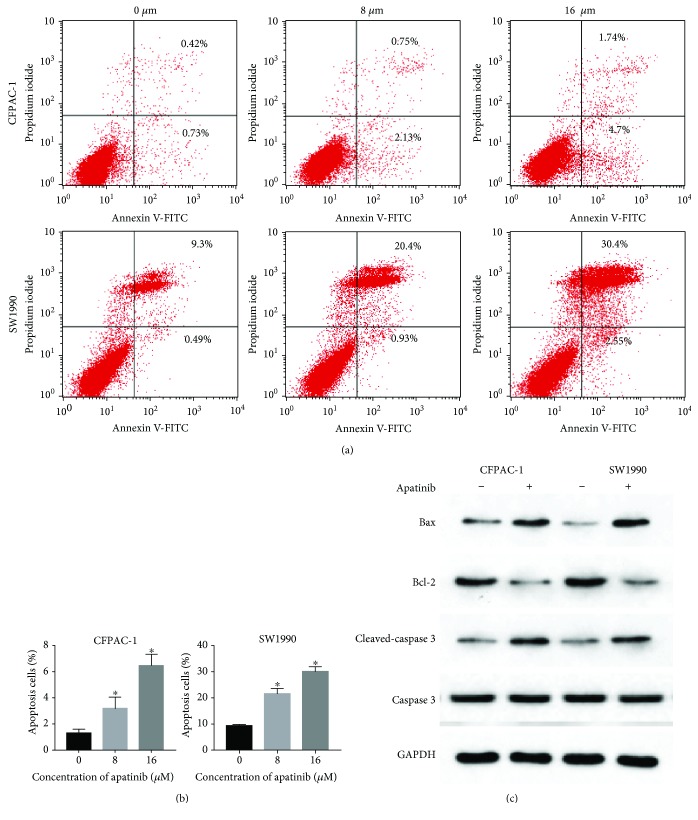
Figure 4.
Apatinib induced apoptosis of pancreatic cancer cells. (a) Following the treatment of CFPAC-1 and SW1990 cells with various concentrations of apatinib (0, 8, and 16 μM) for 24 h, these cells were stained using annexin V-FITC/PI and assessed by FACS analysis. (b) The quantitative analysis of the apoptotic cell numbers is shown. (c) The protein levels of Bcl-2, Bax, caspase-3, and cleaved caspase-3 are shown. All experiments were performed in triplicate. The bars represent mean ± standard deviation; ∗P < 0.05.

