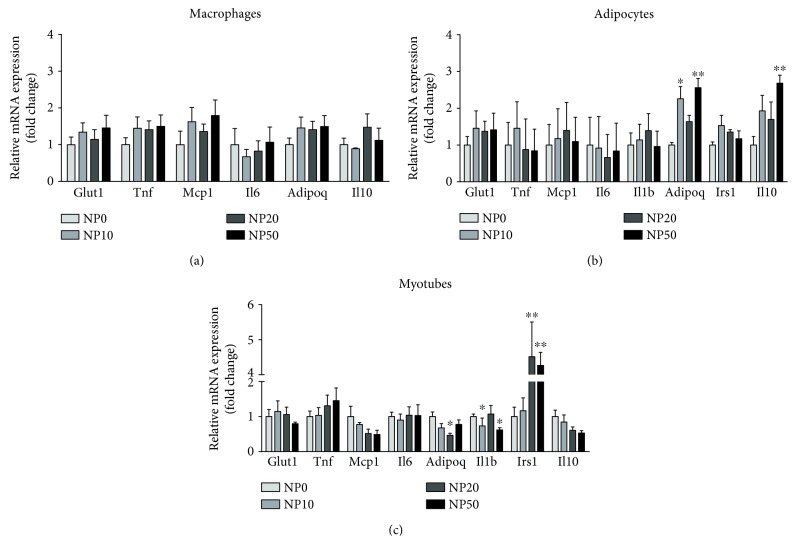
Figure 4.
Relative mRNA expression levels in RAW 264.7 macrophages with LPS (a), 3T3-L1 adipocytes with CM (b), and C2C12 myotubes with CM (c) at 24 h after CeO2 NP treatment at 10, 20, and 50 μg/ml doses. Normalized to Ppia housekeeping gene in fold change compared to nontreated control (NTC). ∗ p < 0.05, ∗∗ p < 0.01; data (n = 6/group) are expressed as mean (SEM). CM: conditioned medium; LPS: lipopolysaccharide.

