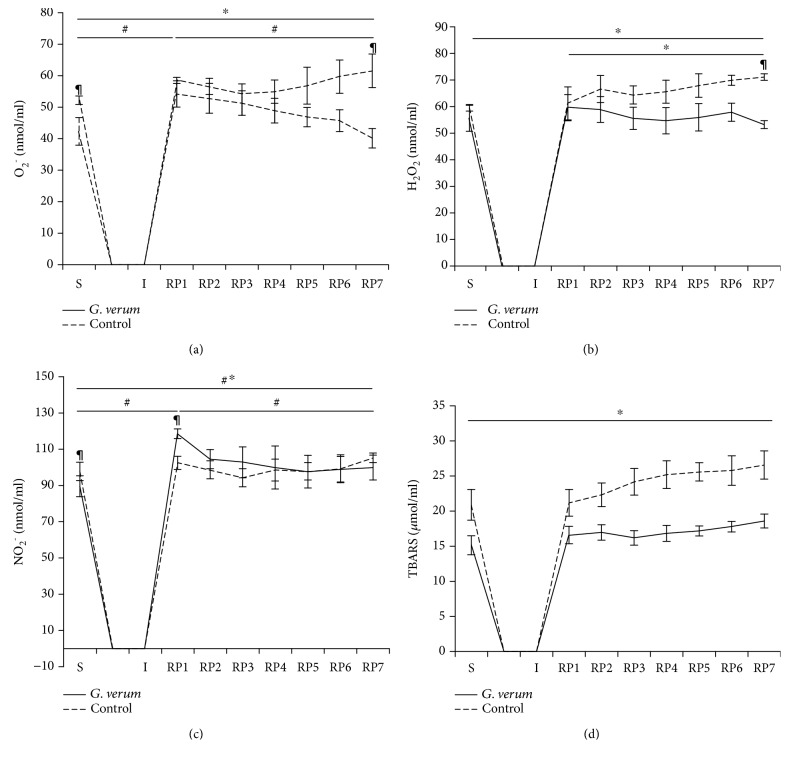
Figure 4.
Effects of G. verum pretreatment on the level of cardiac prooxidants. (a) Comparison within and between groups in the value of O2 −, (b) comparison within and between groups in the value of H2O2, (c) comparison within and between groups in the value of NO2 −, and (d) comparison within and between groups in the value of TBARS. ∗Statistical significance at the level of p < 0.05 within the control group; #statistical significance at the level of p < 0.05 within the G. verum group; ¶statistical significance at the level of p < 0.05 between the control and G. verum group. Data are presented as means ± SE. R1, first minute of reperfusion. R7, last minute of reperfusion.

