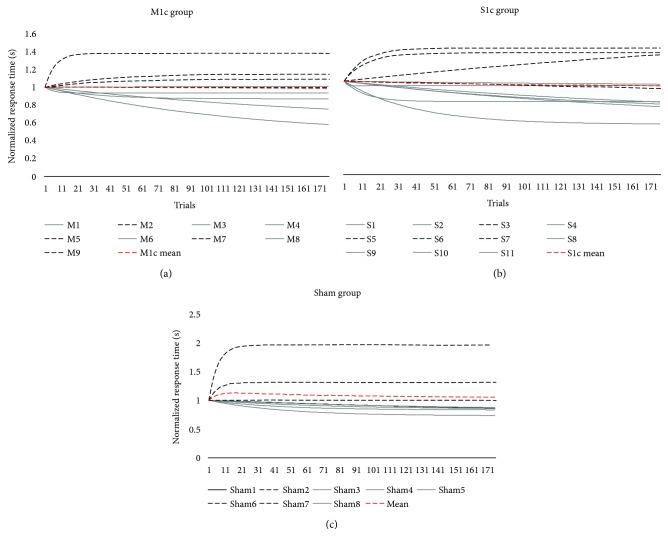
Figure 6.
(a, b, and c) Motor skill acquisition curves for S1c, M1c, and sham stimulation groups. Single-subject normalized motor skill exponential curves for active cTBS stimulation groups (top panel) delivered over the contralesional primary somatosensory (S1c; (a)) and contralesional primary motor cortex (M1c; (b)) and for the sham stimulation group (bottom panel; (c)). Dotted black line indicates individuals with negative B scores and identified as motor skill nonresponders. Solid grey line indicates individuals with positive B scores and identified as motor practice responders. Dashed red line represents the mean motor skill acquisition curve for each stimulation group.

