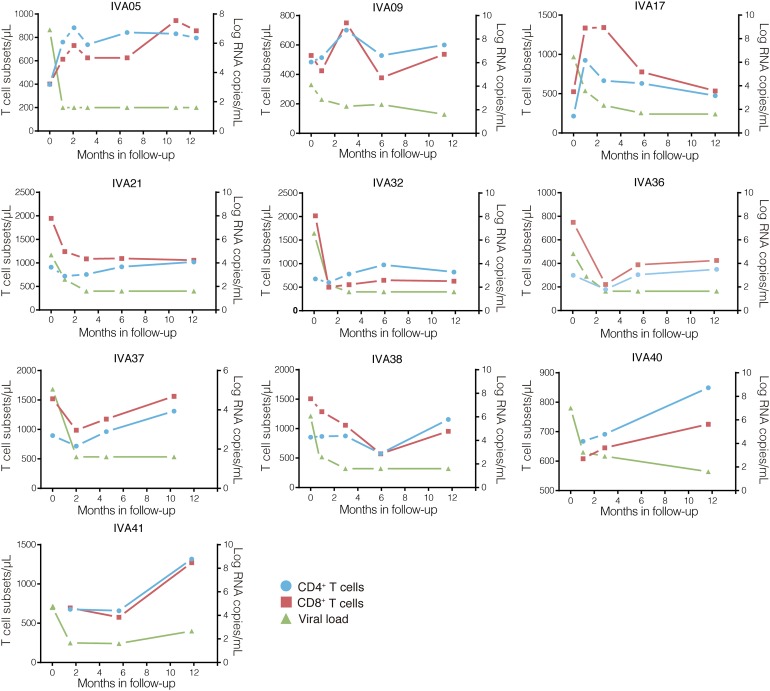
FIGURE 2.
Clinical follow-up of the ten early-treated individuals. T cell counts (cells/μL; CD4+, blue circles; CD8+, red squares) and plasma RNA viral loads (log copies/mL, green triangles) values over time after cART onset (months) are shown on the left and right Y-axis, respectively. The individuals’ identifications are indicated at the top of each graph.

